Beyond Averages: Getting Battery Sizing Right
This article is authored by Ankit Mittal, Ingro Energy. In this article, he explores why hourly, state-specific analysis is critical to sizing solar and battery storage projects in India, and how data-driven modelling can help developers make better investment and project decisions.
Sizing is the decision that decides the project. Every battery installed in India gets sized before it gets bought. How many MWp of solar, how many MWh of storage, in what ratio, usually in a spreadsheet, usually in a week. That number then governs fifteen years of cash flow. Undersize it and the site keeps buying expensive evening power. Oversize it and crores sit idle.
For how fast India is now adding storage in factories, commercial campuses, charging hubs, and bus depots, this step gets remarkably little scrutiny.
Averages hide the battery’s entire business case
The usual method works in annual numbers: yearly consumption, yearly generation, a blended tariff, a payback figure. For solar alone, that was survivable because generation and daytime load roughly coincide.
A battery breaks it. A battery earns nothing from average prices. It earns from the gap between prices at different hours. Storing cheap or self-generated energy and releasing it when power is dear. Average the year and that gap disappears from the model, taking the business case with it. The battery then looks like an expensive way to do what solar already did.
Three things make this sharper in India.
● Time-of-day tariffs are aggressive and getting more so. On a typical HT-industrial connection, the evening peak zone and the solar-hours zone can differ by close to a factor of two once adders apply and the adders shift by season. In the Maharashtra HT-Industrial schedule, the solar-hours rebate runs at one level April-September and a deeper one October-March. An annual average erases both.
● Tariff design is a state subject. Zone boundaries, adder percentages, open-access charges, and banking rules vary by DISCOM and change at every tariff order. A model built on Maharashtra assumptions will quietly mislead in Haryana.
● The load shapes arriving now aren’t factories only. A public charging hub or an electric bus depot concentrates demand in exactly the hours grid power costs most, and draws little when the sun is up. The optimal storage-to-solar ratio for that profile is nothing like a factory’s — yet on an annual basis, the two can consume identical units, so an average-based model cannot tell them apart.
What doing it properly needs
You need an hourly load profile for the full year, an hourly generation profile for the actual site coordinates rather than a generic CUF, the tariff applied hour by hour in its own zone with seasonality intact, dispatch logic deciding each hour whether to serve, charge, discharge, or import. The whole thing is repeated across every credible solar-battery combination, because the optimum is a spectrum, not a point, and it moves with tariff and capex.
Electricity bills are enough
Enter twelve bills, pick state, consumer category, and DISCOM; the official ToD zones, rates, and seasonal adders load themselves. It then simulates 3,171 solar-and-battery combinations against 8,784 hourly rows and returns recommended MWp and MWh, dispatch, energy flows, and cycles alongside annual saving, effective ₹/kWh, payback, and project IRR.
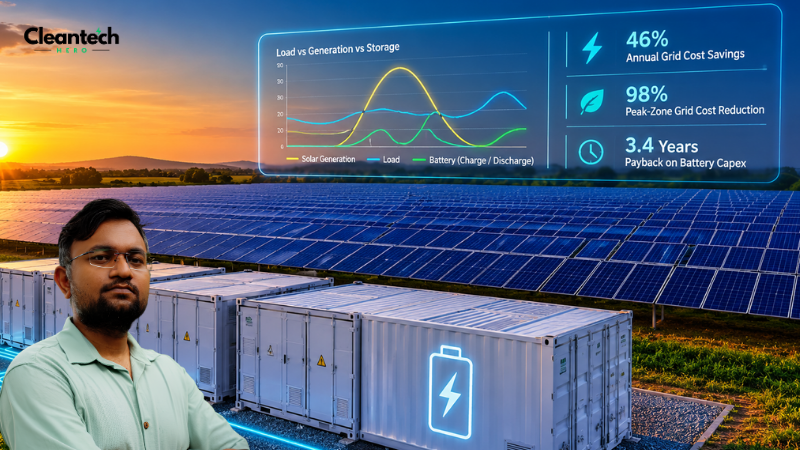
What hourly resolution changes, in one number: on a study we ran for a 10,505 MWh/year industrial site in Maharashtra (MSEDCL HT-Industrial 11 kV), the recommended build was 6.5 MWp solar with 25 MWh storage, cutting annual grid cost from ₹15.82 crore to ₹8.50 crore — 46% — with a 3.4-year payback on battery capex. The interesting figure isn’t the saving but its source: peak-zone grid cost fell 98%, against 87% across all zones. Almost the entire case for the battery lives in seven hours a day. Those are exactly the hours an averaged model cannot see.
A single IRR is a guess wearing a suit
The second failure matters more to anyone financing this. Sizing studies almost always produce one IRR, conditional on a tariff escalation assumption, a capex assumption, a degradation curve, and an availability figure, any of which can be wrong.
The honest output is a range. Run the study across several hundred sampled cases and report what the project returns in the adverse case, not just the central one. For the site above, the P90–P50 IRR band came out at 21.6 – 28.7% against a 12% hurdle. Ranking what actually moved the answer showed tariff level and tariff escalation dominating, while O&M and availability barely registered. That ranking is worth more to a lender than the point estimate, because it says where the risk sits and therefore what’s worth contracting.
From better analysis to better decisions
Static sizing models were built for a simpler energy system, one that no longer exists. As renewable generation, BESS deployment, time-of-day tariffs, and state-specific regulations become more complex, project sizing needs to reflect the actual economics of the Indian grid.
This is where Sims by Ingro Energy fits into the picture. Sims is a decision-analysis platform built for renewable energy and BESS sizing, with its modelling framework designed around Indian market conditions. It integrates state-specific tariff orders, open-access dynamics, and Time-of-Day (ToD) structures across Maharashtra, Haryana, Andhra Pradesh, and other markets.
By bringing these real-world market conditions together with engineering parameters, Sims enables developers and engineers to evaluate different renewable and BESS configurations and build feasibility-grade models in minutes rather than days.
The underlying principle is the same: better sizing starts with better data, higher resolution, and a model that reflects how the project will actually operate. As India’s storage market expands, precision sizing will increasingly determine whether a project simply works on paper or delivers the returns it was designed to achieve.
References: MSEDCL HT-Industrial ToD tariff schedule; NASA POWER solar resource dataset; IESA India C&I energy storage forecast.
Also Read: Battery Energy Storage in India: Geon’s Strategy, Localization, and Policy Outlook
Subscribe to our Newsletter
Subscribe today for free and stay on top of latest developments in Cleantech domain.